Tapping into biomass wastes
Price: 51.5 sen
Market cap: RM202m
Net gearing: (net cash)
BHS Industries shares have been ticking up on good volume recently. I guess this is due to expectations that its “green” venture would drive profit margins up and expand its income base.
“The Board of Directors and management are confident that once the diversification measure using biotechnology Pre Conditioning Refiner Chemical Recycled Bleached Mechanised Pulp [PRC RBMP] has materialised, it will greatly expand the income stream of the Group and at the same time enhance and value add our printing business as we would have our own ample supply and cheaper Empty Fruit Bunches pulp and paper source to cater to our needs and to expand to new markets.” – BHS Industries annual report 2015
With the completion of its rights issue in Oct 2015, BHS should be now in the process of looking for a land to acquire to set up a plant which will use empty fruit bunches (EFB), the by-product or “waste” of palm oil mills, to produce 10,000 tons of wood-free paper. BHS used approximately 9,000 tons of paper in FY14.
With FELDA emerging as a shareholder last year, some believe there will be a collaboration between the two. For example, BHS could source EFB from FELDA’s FGV and build the plant next to the latter’s palm oil mills.
Impact on profit margins
According to BHS’ IPO prospectus, paper is the largest cost component, accounting for about 56% of BHS total purchases in 2007.
In a newsletter article by FRIM in 2002 (link to download), it mentioned using EFB to produce pulp could cost US$120-150 per tonne vs. conventional costs of US$200-300 per ton. In a news article in 2011 (link), there was a mention it could cost as low as RM350 per ton.
The type of pulp that’s related to BHS’ paper cost is the bleached hardwood kraft from Brazil and Chile which fetched approximately US$640 to US$660 per ton in Jun 2015, according to BHS’ abridged prospectus (dated 9 Sep 2015).
If we assume the new plant will cater to all of BHS' paper needs, what kind of impact could it have on earnings? To gauge, let’s make some simple assumptions:
1. Paper cost accounts for 50% of cost of sales.
2. Paper cost will be 60% lower.
BHS P&L FY12 to FY15
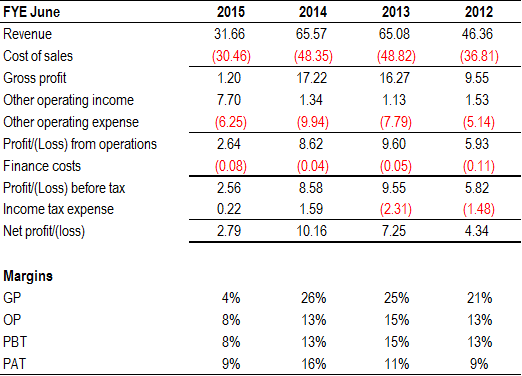
Source: Company annual reports
Let’s use FY14 and FY13 financials as a reference. In this two FYs, revenue was around RM65m and cost of sales in the RM48m range (accounting for 74%-75% of revenue).
1. Paper cost accounts for 50% of cost of sales. Based on COS of RM48m, paper cost is RM24m.
2. Paper cost will be 60% lower. Then, paper cost will RM9.6m, or a cost savings of RM14.4m.
If we added this RM14.4m savings back to FY14’s PBT, net profit (after applying a tax rate 24%) would have jumped to RM17.5m.
Earnings wildcard
The wildcard is BHS being able to sell this technology to palm oil companies. In Malaysia, the target market size is more than 400 palm oil mills. FELDA’s FGV has 71 palm oil mills (not all are located in Malaysia).
BHS is expecting to spend around RM35m for its machinery and equipment. If we assume this is the amount BHS will be selling its technology (along with the machinery, equipment, etc.) to palm oil mills, and assume net margins of 10%, BHS could be looking at RM3.5m per customer/contract. If BHS is able to secure 10% of those 400 mills as customers, it would be seeing relatively huge profits in the future.

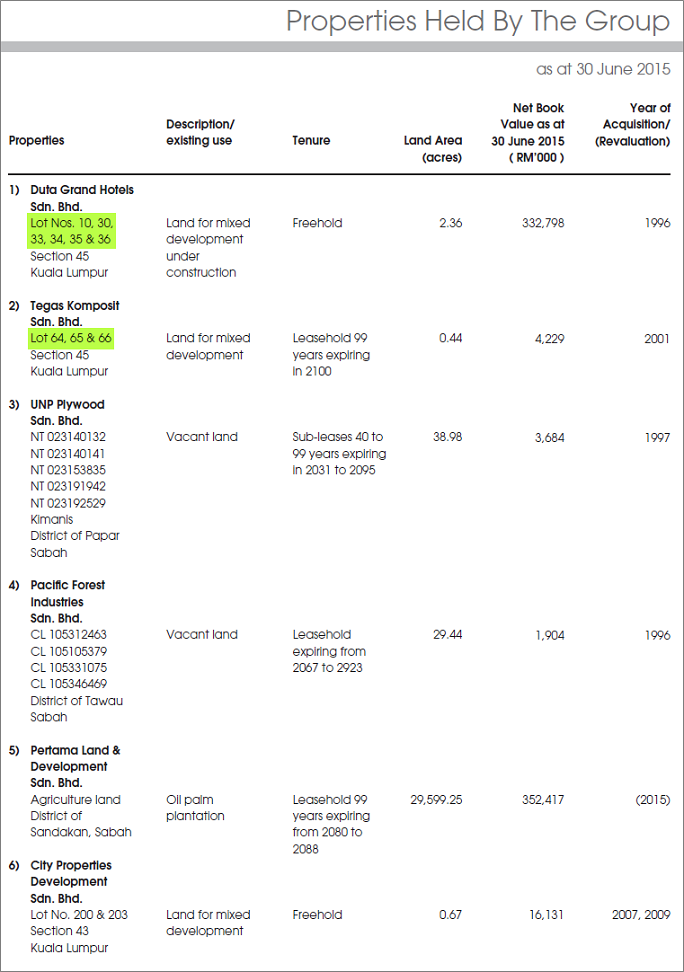
Source: BHS abridged prospectus (dated 9 Sep 2015)

Source: BHS abridged prospectus (dated 9 Sep 2015)
Expecting a recovery in orders
BHS’ financial performance in FY15 was not up to par to that of FY14 and FY13.
This was due to lower print orders received from its major overseas customers in Africa who were affected by the Ebola outbreak, depressed oil prices and a stronger US currency. Customers from Africa accounted for 68% of sales in FY14. The lower production volume and sales in FY15 resulted in lower profit margins as BHS was unable to benefit from economies of scale.
But BHS is expecting things to get better in 2016:
“We would expect the printing orders from our major customers in Africa to resume after the first quarter of 2016 as the Ebola outbreak has subsided and the oil prices have stabilised to a level where their economies are in the process of recovering. The past nine months of low print orders would mean that the customers had relied on their local small printers and their existing stock to meet the demands. They will have to replenish their stock in months ahead and these will generate print orders for us.”
The key factor now is how fast BHS can get its plant up and running. Once done, and everything goes well, it should see potential buyers for its technology. How well BHS’ technology stacks up against competitors out there is unknown to me.
TSH Resources, in collaboration with FRIM and MPOB, had already embarked on a similar venture of using EFB to produce pulp and paper. TSH received a RM50m grant from FRIM for this.
* * * * * * * * *
ENDNOTES
Rights issue with warrants
- Completed 22 Oct 2015
- Rights shares 99,145,199 (RM0.42 issue price). Oversubscribed by 34.22%.
- Warrants 198,290,398 (exercise price: RM0.60, maturity: 18 Oct 2020)
Treasury shares: 26,920,000 (as at 23 Nov 2015)
Issued and paid up shares before rights issue: 320,000,000
Shares outstanding = 320,000,000 + 99,145,199 – 26,920,000 = 392,225,199
Fully diluted shares: 590,515,597